# install.packages("remotes")
remotes::install_github("le-huynh/lehuynh")ggsave_elsevier(): make journal-ready figures easier
tips
R
When preparing figures for a scientific manuscript, getting the plot right is only half the work. We also need to export it at an appropriate size for journal submission.
I created ggsave_elsevier(), a small wrapper around ggplot2::ggsave() in my R package lehuynh to make this step easier. Pick a column width by name, give a height, and the figure is saved at journal-ready size.
Why ggsave_elsevier()?
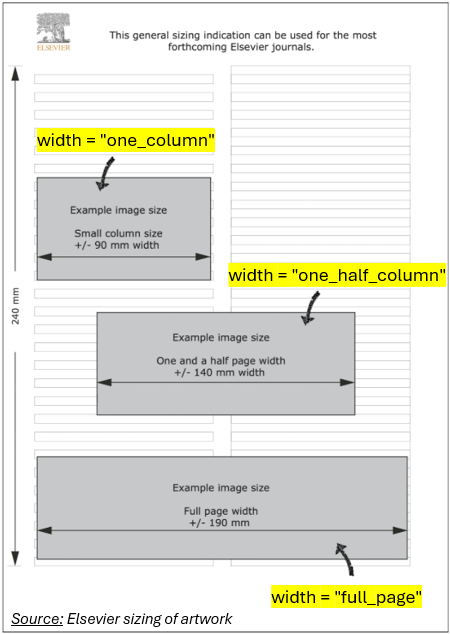
Elsevier’s artwork sizing guidelines provide recommended artwork widths for different figure layouts:
width = |
Layout | Width |
|---|---|---|
"one_column" |
Single column | 90 mm |
"one_half_column" |
1.5 column | 140 mm |
"full_page" |
Double column (full width) | 190 mm |
Height is up to us, in millimetres, with a maximum of 240 mm.
Installation
Usage
ggsave_elsevier(filename,
                plot,
                width = c("one_column", "one_half_column", "full_page"),
                height,
...)library(ggplot2)
library(lehuynh)
fig <- ggplot(mtcars, aes(x = disp, y = mpg)) +
geom_point(aes(colour = factor(cyl)))
ggsave_elsevier("figure1.png",
plot = fig,
width = "full_page",
height = 120)That’s it: figure1.png is 190 mm wide and 120 mm tall.
Anything that passes through ... goes straight to ggplot2::ggsave(), so we keep full control over resolution, file format, and device, e.g. dpi = 300 or a .tiff / .pdf filename.
Why bother with a wrapper?
- No more magic numbers.
width = "one_column"reads better in a script thanwidth = 90, units = "mm", and it documents intent. - Design at final size. Saving at the real print width early means font sizes, point sizes, and legends get tuned for how the figure will actually appear in the journal, not how it looks in RStudio’s plot pane.
- Consistency across a manuscript.
Give it a try
- Function documentation:
ggsave_elsevier() - Source code and issues: github.com/le-huynh/lehuynh
Give it a try! If you run into any issues or have ideas for similar helpers, feel free to open an issue on GitHub. I’d love to hear about it!